Loading health centre …
Ängelholm · Skåne
Capio Vårdcentral Ängelholm
Capio Vårdcentral Ängelholm has a Vårdbetyg of 78.9 out of 100 (a high score), based on 90 responses in the National Patient Survey 2025. That is 2.3 points below the national average (81.2), and rank 4 of 5 rated health centres in Ängelholm. 76% of patients get a medical assessment within 3 days (August 2026).
Updated with the National Patient Survey 2025 · Waiting times: August 2026
Vårdbetyg
Vårdbetyg
78.9/ 100High score
2.3 below the national average (81.2)
Based on 90 responses from 200 patients asked (45%)
Cannot be told apart from the national average
The margin of error for patients' answers reaches the national average, so the difference may come down to who happened to answer. How to read the margin of error.
Where Capio Vårdcentral Ängelholm sits in the whole distribution
Combined from patient experience (75.1, from the patient survey) and accessibility (87.8, from waiting times), adjusted toward the national average. How we calculate it.
Why this rating?
Two parts, each first shrunk toward the national average by how many answered, then weighted:
- Patient experience75.1 · weight 70 %
- Accessibility87.8 · weight 30 %
Combined rating 78.9
Patient experience builds on the unit’s own answers about 75 %; the rest is drawn toward the national average for patient experience (78.2) because 90 patients answered. Fewer answers means a stronger pull, so a thin basis can’t top the ranking on chance. Worked example: raw mean vs Vårdbetyg.
At a glance
- Trend 2015–2025 (Respect and empathy)Unchanged 2015–202477.32015: 87.7New measurement 2025
- Rank in the municipalityNo. 4 of 5
- Waiting time8 in 10
- Nearest with a higher VårdbetygLäkargruppen Munka Ljungby82.2 · 6.3 kmVårdcentralen Förslöv83.5 · 12 km
Vaccination against flu and COVID-19
In Region Skåne, vaccinations start on 2 November. 1177 explains who is offered the vaccine and what it costs.
Read about the vaccination in Region Skåne on 1177 (in Swedish)
Source: Region Skåne, checked 1 October 2026.
Patient ratings by dimension
What the symbols mean:
- This health centre
- National average
- Margin of error – how much the number can vary
The wider the line around the dot, the less certain the figure, usually because fewer people responded. Read more in the methodology.
- Care and treatmentPatient survey · 82 responses76.4
Municipality 76.2 · Region 78.9
- Respect and empathyPatient survey · 83 responses77.3
Municipality 80.3 · Region 83.2
- InvolvementPatient survey · 83 responses76.0
Municipality 76.9 · Region 79.8
- InformationPatient survey · 83 responses71.9
Municipality 71.3 · Region 74.6
- Continuity – seeing the same staffPatient survey · 82 responses68.2
Municipality 67.5 · Region 71.0
Share of listed patients with a named regular doctor: 81% (Q3 2026)
- AccessibilityPatient survey · 88 responses74.3
Municipality 75.3 · Region 80.1
How patients answered, question by question
The individual questions behind each dimension, with how patients answered. Added depth that does not count toward the Vårdbetyg.
Care and treatment
How did you experience the care you received during the visit?
77.883 answers to this question
- Very good54 %
- Fairly good28 %
- Fairly bad10 %
- Very poor6 %
- Not applicable / Don't know2 %
How much trust did you have in the doctor?
75.583 answers to this question
- A lot49 %
- Quite a lot30 %
- Not much7 %
- None at all8 %
- Not applicable / Don't know5 %
Respect and empathy
Did you feel that the doctor took you and your health problems seriously?
71.985 answers to this question
- Completely52 %
- For the most part19 %
- Somewhat18 %
- Not at all9 %
- Not applicable / Don't know2 %
What was your experience of how the doctor treated you?
82.785 answers to this question
- Very good62 %
- Fairly good25 %
- Fairly bad6 %
- Very bad5 %
- Not applicable / Don't know2 %
Involvement
How did you feel that the doctor listened to you?
79.083 answers to this question
- Very well55 %
- Fairly well29 %
- Fairly badly7 %
- Very badly6 %
- Not applicable / Don't know2 %
How did you experience the opportunity to be involved in your care?
70.183 answers to this question
- Very good37 %
- Fairly good34 %
- Fairly bad16 %
- Very bad6 %
- Not applicable / Don't know7 %
What is your experience of being able to ask questions?
79.280 answers to this question
- Completely56 %
- For the most part29 %
- Not really11 %
- Not at all4 %
- Not applicable / Don't know0 %
How did you experience the opportunity for relatives to be involved in your care as much as you wanted?
82.881 answers to this question
- Very good23 %
- Fairly good11 %
- Fairly bad2 %
- Very bad1 %
- Not applicable / Don't know62 %
Information
Did you receive information that suited you?
71.583 answers to this question
- Completely43 %
- For the most part36 %
- Somewhat12 %
- Not at all8 %
- Not applicable / Don't know0 %
What did you think about the information regarding the next steps?
73.282 answers to this question
- Very good38 %
- Fairly good39 %
- Fairly bad12 %
- Very bad4 %
- Not applicable / Don't know7 %
Continuity
How well informed did you feel the doctor was about your medical history and previous care?
69.685 answers to this question
- Very well36 %
- Quite well36 %
- Quite badly14 %
- Very badly7 %
- Not applicable / Don't know6 %
How did you experience the opportunity to see a doctor you had seen before?
72.481 answers to this question
- Very good40 %
- Fairly good14 %
- Fairly bad10 %
- Very bad9 %
- Not applicable / Don't know28 %
How did you experience that the coordination with other care and services worked?
64.682 answers to this question
- Very well22 %
- Fairly well20 %
- Fairly badly9 %
- Very badly9 %
- Not applicable / Don't know41 %
Accessibility
How did you experience the waiting time until you could visit the health/medical center?
77.990 answers to this question
- Short (reasonable)67 %
- Somewhat too long16 %
- Far too long13 %
- Not applicable / Don't know4 %
How do you think it works to get in touch with the health/medical center?
72.482 answers to this question
- Very well38 %
- Fairly well44 %
- Fairly badly16 %
- Very badly2 %
- Not applicable / Don't know0 %
The figure is the same 0–100 scale as the dimensions above, per question. The distribution includes the Not applicable / Don’t know answer, so the bars add up to 100 %.
Waiting times
Primary-care waiting-time statistics from the National Board of Health and Welfare, August 2026. The figures are preliminary. The median is the midpoint, half waited less. Only assessment within 3 days and answered calls count toward the Vårdbetyg; the other rows are context. Not the same as the Accessibility dimension in the survey above.
- Medical assessment within 3 days
- 76%
- Medical assessment the same day
- 53%
- Median wait for an assessment
- 0 days
- Waiting time for 9 in 10 patients
- 7 days
- Answered calls (phone/chat)
- 100%
Month by month
The two measures that count toward the Vårdbetyg, month by month over the past year. The scale runs from 0 to 100%. A month without a figure in the source is left empty, and we never fill it in.
| Month | Share |
|---|---|
| September 2025 | 86% |
| October 2025 | 89% |
| November 2025 | 77% |
| December 2025 | 88% |
| January 2026 | 89% |
| February 2026 | 83% |
| March 2026 | 84% |
| April 2026 | 81% |
| May 2026 | 75% |
| June 2026 | 73% |
| July 2026 | 72% |
| August 2026 | 76% |
76% in August 2026. The same month, Skåne had 87% and Sweden as a whole 87%.
| Month | Share |
|---|---|
| September 2025 | 100% |
| October 2025 | 100% |
| November 2025 | 100% |
| December 2025 | 100% |
| January 2026 | No figure |
| February 2026 | 100% |
| March 2026 | 100% |
| April 2026 | 96% |
| May 2026 | 100% |
| June 2026 | No figure |
| July 2026 | 94% |
| August 2026 | 100% |
100% in August 2026. The same month, Skåne had 95% and Sweden as a whole 91%.
The source has no figure for January 2026 and June 2026, so the curve has gaps there.
Source: National Board of Health and Welfare, primary care waiting times. Open data at the statistics database.
Waiting time by profession
The unit has reported assessments by a counsellor in at least three of the past twelve months.
How many in 100 had a medical assessment within 3 days in August 2026, by profession. Not part of the Vårdbetyg. The score’s waiting-time part uses the National Board of Health and Welfare’s figures for August 2026, all professions together.
- Doctor
- 78 in 100 (232 assessments, Sweden as a whole 89 in 100)
- Nurse
- 65 in 100 (40 assessments, Sweden as a whole 91 in 100)
We only show professions with at least 30 assessments in the month. With fewer, a handful of patients can move the figure a lot. One profession had too few assessments to be shown.
Source: Väntetider i vården, SKR (August 2026). Open data via https://vardenisiffror.se/. What to consider when reading the figures (in Swedish)
Do they take care of you?
Do you see the same staff?
Continuity in the patient survey: 68.2 – below the national average (70.5) · 82 responses
Share of listed patients with a named regular doctor: 81% (Q3 2026)
Can you reach them?
Medical assessment within 3 days: 76%
Answered calls: 100%
Are you involved?
Involvement: 76.0 – below the national average (80.4)
Information: 71.9 – below the national average (74.9)
Patterns in open data, not judgements about staff. Averages for the whole unit, not your own wait. What we cannot measure is listed under What we can’t measure.
Contact and opening hours
Not part of the scorePhone0431-47 40 50
Opening hours
- Monday–Friday
- 08:00–17:00
- Saturday–Sunday
- Closed
Phone hours
- Monday–Friday
- 08:00–17:00
- Saturday–Sunday
- Closed
Location
Bruksgatan 25, ÄngelholmView on map (OpenStreetMap)E-services
- Sök vård digitalt i Capio Go
- Boka tid
- Stöd och behandling
- Kontakta oss för att boka tid
- Kontakta oss för att omboka eller avboka tid
- Förnya recept på läkemedel
- +5 more
Register with Capio Vårdcentral Ängelholm (1177.se)
Source: 1177 Hitta vård (the HSA catalogue), retrieved 11 October 2026. Details may change – check 1177.se.
Is something wrong here?
What is wrong? We only count which option you choose, nothing about you.
To tell us more, email hej@vardbetyg.se.
Patient fee. A doctor's appointment costs SEK 200, the same as at every health centre in Region Skåne. Fees and the exemption card in Skåne County
Trend 2015–2025
2015–2024: worse on accessibility, emotional support, and overall impression. The other dimensions are unchanged.
From the National Patient Survey. The survey was redesigned in 2025, so 2025 is shown separately and is not compared with earlier years. The trend covers Primärvård (2015-2024); years without a survey are left blank. Small ups and downs that could just as well reflect who happened to respond count as unchanged, not as a change.
Where the municipality has at least 3 primary care units with comparable measurements, the municipal average is shown as a dashed reference line. The average is calculated on the same units throughout the series.
- Respect and empathyUnchanged 2015–2024 · 10 measurement periods77.32015: 87.7New measurement 2025
The municipal average in Ängelholm fell 2015–2024 (average of 5 primary care units).
- InvolvementUnchanged 2015–2024 · 10 measurement periods76.02015: 78.0New measurement 2025
The municipal average in Ängelholm fell 2015–2024 (average of 5 primary care units).
- InformationUnchanged 2015–2024 · 10 measurement periods71.92015: 74.2New measurement 2025
The municipal average in Ängelholm fell 2015–2024 (average of 5 primary care units).
- ContinuityUnchanged 2015–2024 · 10 measurement periods68.22015: 72.3New measurement 2025
The municipal average in Ängelholm fell 2015–2024 (average of 5 primary care units).
- AccessibilityWorse 2015–2024 · 10 measurement periods74.32015: 87.9New measurement 2025
The municipal average in Ängelholm fell 2015–2024 (average of 5 primary care units).
- Emotional supportWorse 2015–2024 · 10 measurement periods61.62015: 81.42024
Not measured in the 2025 survey.
- Overall impressionWorse 2015–2024 · 10 measurement periods69.12015: 88.22024
Not measured in the 2025 survey.
Was this helpful?
Basis
How many responses the Vårdbetyg is built on. More responses give a more reliable result.
- Response rate
- 45%
- Responses
- 90
- Surveys sent
- 200
- Reported results in the patient survey since
- 2015 or earlier
Independence: no care provider pays for placement or scores, no sponsorship, no submitted reviews. Only open sources: the National Patient Survey 2025 and the National Board of Health and Welfare’s waiting times. How we stay independent.
Below are facts and context. None of it counts toward the Vårdbetyg.
About the health centre
- Operating form
- Private
- Address
- Bruksgatan 25, Ängelholm
Source: Region Skåne (open data).
Was this helpful?
Named regular doctor
- Share of listed patients with a named doctor
- 81%
- Listed patients
- 10,169
A full count from the region’s listing register at the extract date (Q3 2026), not a survey or a rating. It shows who patients are listed with, not necessarily who they see at each visit. A low share can reflect how the clinic registers listings, and a unit with many elderly or chronically ill patients can have a structurally higher share. In some regions nearly all patients are listed with a named doctor, so the share sits close to 100% for most.
Source: the region’s listing register, released public record. How the measure is derived in the methodology.
Was this helpful?
Do patients see the same doctor?
- Share who saw the same doctor more than half of their visits
- 33%
- Sample (more than three doctor visits in six months)
- 19 of 57 patients
The region’s continuity index, a follow-up figure and not a rating: the share of patients who saw the same doctor more than half of their visits, among patients with more than three physical doctor visits during March 2026–August 2026. Unlike named GP contact (who you are listed with), it measures who patients actually saw. The sample is small at many units, so the figure is an indication rather than an exact truth; we only show it when at least 30 patients are included.
Source: Region Skåne’s primary-care quality follow-up (indicator 3.2), released public record. How the measure is derived in the methodology.
Was this helpful?
Summary
AI-generated
Capio Vårdcentral Ängelholm scores 78.9 of 100 on the Vårdbetyg, slightly below the national average of 81.2, based on 90 survey responses with a 45% response rate, so results should be read with some caution given the moderate sample size. Across the survey dimensions, all areas fall below national averages, with Respect and empathy showing the largest gap (77.3 vs. 84 nationally), while Continuity (68.2 vs. 70.5) and Information (71.9 vs. 74.9) are closer to typical levels. Waiting-time data show all calls were answered on first contact (100%), though only 76% of patients received a medical assessment within 3 days, a somewhat lower share than many centres report.
Automatically generated summary, grounded in the figures on this page (the patient survey 2025).
Was this helpful?
Asthma and COPD
Swedish Airway Register
How many in 100 of the practice’s asthma and COPD patients in the Swedish Airway Register (Luftvägsregistret) received the follow-up the guidelines recommend in 2025. The figures describe how follow-up is done, not how good the care is for any one patient, and they are not part of the Vårdbetyg.
Asthma
- Asthma under control according to a questionnaire (ACT)
- 62 in 100 (100 patients, Sweden as a whole 64, Skåne 67, target 95)
- Lung function measured (spirometry)
- 100 in 100 (100 patients, Sweden as a whole 98, Skåne 100, target 95)
- Written treatment plan
- Too few patients to show a figure (Sweden as a whole 50, Skåne 89, target 80)
COPD (chronic obstructive pulmonary disease)
- Symptoms assessed with a questionnaire (CAT)
- 62 in 100 (80 patients, Sweden as a whole 56, Skåne 74, target 95)
- Lung function measured (spirometry)
- 100 in 100 (40 patients, Sweden as a whole 96, Skåne 100, target 95)
- Written treatment plan
- Too few patients to show a figure (Sweden as a whole 50, Skåne 87, target 95)
Patient counts are rounded to the nearest ten in the source. When fewer than 20 patients are included, or when the register itself has hidden the figure, the row says the patients are too few instead.
Source: Luftvägsregistret (2025). Open data via https://vardenisiffror.se/. What to consider when reading the figures (in Swedish)
Context in Skåne
Figures for the whole region, never this health centre's own.
Diabetes care
Share of the region’s primary-care diabetes patients reaching the target value, from the Swedish National Diabetes Register (2025). The row on high blood-sugar level is the exception and instead shows the share above 70 mmol/mol.
- Good blood-sugar control (HbA1c < 52 mmol/mol)
- 62%
- High blood-sugar level (HbA1c > 70 mmol/mol), lower is better
- 8%
- Blood pressure below 140/85 mmHg
- 57%
- Foot examination performed
- 71%
- Lipid-lowering treatment
- 79%
Source: the Swedish National Diabetes Register via Vården i siffror.
Antibiotics
Antibiotic prescriptions per 1,000 inhabitants in the region’s outpatient care. Strama’s target is at most 250 prescriptions per 1,000 inhabitants per year (2025). Lower is better.
- Antibiotic prescriptions per 1,000 inhabitants
- 277
Source: the Public Health Agency of Sweden, antibiotics statistics.
Complaints to IVO
Complaints to IVO about primary care in the region that were investigated on the merits, and how many were closed with criticism, in total 2018-2025.
- Complaints investigated on the merits (total)
- 270
- Of which closed with criticism
- 118
IVO investigates only a small share of all complaints on the merits (most go to the patient committee), and the count also reflects the region’s size, so it is not a quality ranking. Small counts are suppressed at the source, so the figure is a lower bound.
Source: the Health and Social Care Inspectorate, IVO statistics database (table EKPSL09, primary care).
Concerns to the patient committee
Concerns about primary care submitted to the region’s patient advisory committee (2025), and the areas they most often relate to.
- Complaints about health centres (total)
- 2,400
- Health centres with at least one case
- 173 of 182
- Share concerning examination/assessment
- 27%
- Share concerning staff attitude
- 15%
- Share concerning accessibility
- 8%
A case is a submitted concern, not a verified deficiency, and the count also reflects the region’s size. The counts cover health centres, not other primary care (rehab, child health services and so on), and health centres without cases are not part of the extract. Shares refer to categorisations in the region’s own scheme; one case can concern several areas.
Source: the region’s patient advisory committee, released public record.
Was this helpful?
What we can’t measure
Vårdbetyg is built only on open, year-stamped sources. Some of what patients care about most is not in any open data per health centre. When that is the case we say so plainly instead of guessing.
- Whether a clinic offers or upsells private add-ons.
- How often it refers or passes you on instead of caring for you itself.
- Whether it profits from rebooking you.
The Swedish National Diabetes Register does not publish its results per health centre as open data. In October 2026 we asked the register whether we may show them. The Swedish Association of Local Authorities and Regions (SKR) publishes PrimärvårdsKvalitet, which among other things measures whether patients have a named regular doctor, only per region. For figures per health centre, SKR refers to the regions.
A missing figure like this does not mean anything is wrong with this particular health centre, only that it can’t be measured fairly in open data. We never put a number or a judgement on something we can’t substantiate, and never single out an individual clinic on a guess.
Have a concern about a specific health centre? Your region’s patient advisory committee (patientnämnden) receives it free of charge, and serious deficiencies can be reported to IVO.
Questions to ask the health centre (3)
This does not show in the statistics, but you can ask the clinic yourself. The questions are chosen by which figures we lack, and are the same for every health centre in the same situation.
- If I need to see a specialist, how does the referral work and how will I hear back?
- What do things outside the high-cost protection cost, such as certificates?
- Do you make home visits, and how do you coordinate care with home care services for a relative?
Which of these would you most like to know?
We only count how many press each option. The answer is about the question, not about this health centre.
Ratings and reviews for Capio Vårdcentral Ängelholm
The Vårdbetyg above is built on patient ratings from the National Patient Survey, a systematic survey that outweighs individual reviews. Fresh Google reviews appear as a standalone complement when available.
Other health centres in Ängelholm
Similar health centres in Skåne
Health centres in the county with the closest Vårdbetyg, in other municipalities.
- Vårdcentralen Ystad Vårdbetyg 78.9
- Capio Vårdcentral Hässleholm Vårdbetyg 79.0
- Vårdcentralen Granen Vårdbetyg 79.0
- Kattens Läkargrupp Vårdbetyg 78.8
- God Hälsa Vårdcentral Kirseberg Vårdbetyg 79.1
- Väla Hälsocenter Vårdcentral Vårdbetyg 79.1
Embed this rating
For health centres
Proud of your rating? Copy the code and show the Vårdbetyg on your own website. The badge updates automatically when new data arrives and links back here. No cookie, no tracking.
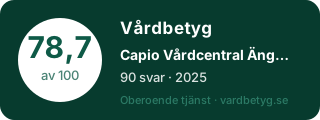 This is how the badge looks.
Frequently asked questions
How good is Capio Vårdcentral Ängelholm?
Capio Vårdcentral Ängelholm has a Vårdbetyg score of 78.9 out of 100, which is a high score. The Vårdbetyg is a combined measure of how patients experience the health centre and how accessible it is, based on the National Patient Survey 2025 and the National Board of Health and Welfare's waiting-time statistics.
How is the Vårdbetyg score calculated?
The Vårdbetyg weights patient experience (the National Patient Survey answers) at 70% and accessibility (waiting times from the National Board of Health and Welfare) at 30%. Before the parts are combined, each is pulled toward its own national average when the basis is small (the method is called Bayesian shrinkage), patient experience by how many people responded and accessibility by how many cases the waiting times are based on. The combined score is not adjusted a second time. A health centre with a thin basis should therefore not be able to top the ranking by chance. The method is open.
How many people responded about Capio Vårdcentral Ängelholm?
The Vårdbetyg for Capio Vårdcentral Ängelholm is based on 90 patients who responded to the National Patient Survey 2025. That corresponds to a response rate of 45%. We always show the number of responses and the margin of error next to the score, so it is clear how solid the basis is.
Source: National Patient Survey 2025 (SKR). Open data at resultat.patientenkat.se.