Loading health centre …
 VårdbetygVårdbetyg
Västerås · Västmanland
Familjeläkarna Önsta-Gryta has a Vårdbetyg of 74.3 out of 100 (an average score), based on 93 responses in the National Patient Survey 2025. That is 3.9 points below the national average (78.2), and rank 12 of 13 rated health centres in Västerås.
The Vårdbetyg is not a raw average of the responses. Few responses are pulled toward the national average, so a high average on thin evidence cannot top the ranking by chance. How we calculate it
Updated with the National Patient Survey 2025
Vårdbetyg
3.9 below the national average (78.2)
Based on 93 responses
Combined from 6 survey dimensions and adjusted toward the national average based on 93 responses. How we calculate it.
The survey dimensions average 73.1, shrunk toward the national average (78.2) by 93 responses to 74.3. Accessibility data is missing, so the rating rests on patient experience alone.
Patient experience builds on the unit’s own answers about 76 %; the rest is drawn toward the national average for patient experience (78.2) because 93 patients answered. Fewer answers means a stronger pull, so a thin basis can’t top the ranking on chance.
The Vårdbetyg normally combines patient experience (70%) with accessibility (30%); this unit lacks waiting-time data, so its score rests entirely on patient experience from the National Patient Survey 2025. Here you also find what a survey does not show: contact details, opening hours and e-services. How the score is calculated.
What the symbols mean:
The wider the line around the dot, the less certain the figure, usually because fewer people responded. Read more in the methodology.
Municipality 78.5 · Region 78.2
Municipality 83.6 · Region 83.5
Municipality 81.0 · Region 79.8
Municipality 75.7 · Region 74.9
Municipality 70.6 · Region 70.1
Municipality 80.3 · Region 82.8
Each dimension is built from several survey questions. Here are the individual questions and how patients answered. This is added depth; none of it counts toward the Vårdbetyg.
How did you experience the care you received during the visit?
93 answers to this question
How much trust did you have in the doctor?
91 answers to this question
Did you feel that the doctor took you and your health problems seriously?
93 answers to this question
What was your experience of how the doctor treated you?
92 answers to this question
How did you feel that the doctor listened to you?
91 answers to this question
How did you experience the opportunity to be involved in your care?
92 answers to this question
What is your experience of being able to ask questions?
91 answers to this question
How did you experience the opportunity for relatives to be involved in your care as much as you wanted?
91 answers to this question
Did you receive information that suited you?
90 answers to this question
What did you think about the information regarding the next steps?
90 answers to this question
How well informed did you feel the doctor was about your medical history and previous care?
92 answers to this question
How did you experience the opportunity to see a doctor you had seen before?
90 answers to this question
How did you experience that the coordination with other care and services worked?
90 answers to this question
How did you experience the waiting time until you could visit the health/medical center?
93 answers to this question
How do you think it works to get in touch with the health/medical center?
91 answers to this question
The figure is the same 0–100 scale as the dimensions above, per question. The triangle marks the national average. The distribution includes the Not applicable / Don’t know answer, so the bars add up to 100 %. No per-question figure affects the Vårdbetyg.
Three questions many people ask when choosing, answered with the same open figures shown on this page. No new measures, no new score.
Continuity in the patient survey: 61.3 – below the national average (70.5) · 88 responses
The share with a named regular doctor is not available as open data for this region.
Waiting-time data is not available for this unit.
Involvement: 75.4 – below the national average (80.4)
Information: 69.6 – below the national average (74.9)
These are patterns in open data, not judgements about staff or intentions. Differences from the national average can have many explanations, and the figures say nothing about why they look the way they do. What we cannot measure is listed under What we can’t measure.
How many responses the Vårdbetyg is built on. More responses give a more reliable result.
Independence: no care provider pays for placement or scores on Vårdbetyg, and we carry no sponsorship and no booking commission. The scores are calculated solely from open, year-stamped sources – the National Patient Survey 2025 and the National Board of Health and Welfare’s waiting-time statistics – never from submitted reviews. How we stay independent.
Below are facts and context. None of it counts toward the Vårdbetyg.
Facts about the health centre.
Source: 1177 Hitta vård (the HSA catalogue).
Contact details and opening hours from 1177. Not part of the Vårdbetyg score.
Register with Familjeläkarna Önsta-Gryta (1177.se)
Source: 1177 Hitta vård (the HSA catalogue), retrieved 18 August 2026. Details may change – check 1177.se.
The health centre's address and location.
Familjeläkarna Önsta-Gryta scores 74.3 on the Vårdbetyg scale, below the national average of 78.2, based on 93 responses with a 47% response rate. Across the survey dimensions, respect and empathy stands out as the strongest area at 79.9, though still under the national figure of 83.9, while continuity is the weakest at 61.3, notably below the national average of 70.5. All other dimensions, including care and treatment, involvement, information, and accessibility, also fall below their respective national averages. Given the moderate sample size, results should be interpreted with some caution.
Automatically generated summary, grounded in the figures on this page (the patient survey 2025).
Share of the region’s primary-care diabetes patients reaching the target value, from the Swedish National Diabetes Register (2024). The row on high blood-sugar level is the exception and instead shows the share above 70 mmol/mol.
This is regional context, not this health centre’s own figures.
Source: the Swedish National Diabetes Register via Vården i siffror.
Antibiotic prescriptions per 1,000 inhabitants in the region’s outpatient care. Strama’s target is at most 250 prescriptions per 1,000 inhabitants per year (2025).
This is regional context, not this health centre’s own figures. Lower is better.
Source: the Public Health Agency of Sweden, antibiotics statistics.
Complaints to IVO about primary care in the region that were investigated on the merits, and how many were closed with criticism, in total 2018-2025.
This is regional context, not this health centre’s own figures. IVO investigates only a small share of all complaints on the merits (most go to the patient committee), and the count also reflects the region’s size, so it is not a quality ranking. Small counts are suppressed at the source, so the figure is a lower bound.
Source: the Health and Social Care Inspectorate, IVO statistics database (table EKPSL09, primary care).
Vårdbetyg is built only on open, year-stamped sources. Some of what patients care about most is not in any open data per health centre. When that is the case we say so plainly instead of guessing.
A missing figure like this does not mean anything is wrong with this particular health centre, only that it can’t be measured fairly in open data. We never put a number or a judgement on something we can’t substantiate, and never single out an individual clinic on a guess.
Have a concern about a specific health centre? Your region’s patient advisory committee (patientnämnden) receives it free of charge, and serious deficiencies can be reported to IVO.
Which of these would you most like to know?
We only count how many press each option. The answer is about the question, not about this health centre.
The Vårdbetyg above is built on patient ratings from the National Patient Survey, a systematic survey that outweighs individual reviews. Fresh Google reviews appear as a standalone complement when available.
Health centres in the county with the closest Vårdbetyg, in other municipalities.
Proud of your rating? Copy the code and show the Vårdbetyg on your own website. The badge updates automatically when new data arrives and links back here. No cookie, no tracking.
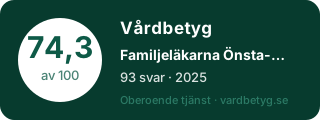 This is how the badge looks.
Familjeläkarna Önsta-Gryta has a Vårdbetyg score of 74.3 out of 100, which is an average score. The Vårdbetyg normally combines patient experience with accessibility, but this health centre has no waiting-time data, so its score rests entirely on patients' answers in the National Patient Survey 2025.
The Vårdbetyg weights patient experience (the National Patient Survey answers) at 70% and accessibility (waiting times from the National Board of Health and Welfare) at 30%. Before the parts are combined, each is pulled toward its own national average when the basis is small (the method is called Bayesian shrinkage), patient experience by how many people responded and accessibility by how many cases the waiting times are based on. The combined score is not adjusted a second time. A health centre with a thin basis should therefore not be able to top the ranking by chance. The method is open. When a health centre has no waiting-time data the weights are recomputed so the score rests entirely on patient experience, which is the case here. A missing part never drags the score down.
The Vårdbetyg for Familjeläkarna Önsta-Gryta is based on 93 patients who responded to the National Patient Survey 2025. That corresponds to a response rate of 47%. We always show the number of responses and the margin of error next to the score, so it is clear how solid the basis is.
Source: National Patient Survey 2025 (SKR). Open data at resultat.patientenkat.se.